PULMONARY PHYSIOLOGY-OXYHEMOGLOBIN DISSOCIATION CURVE
SUMMARY
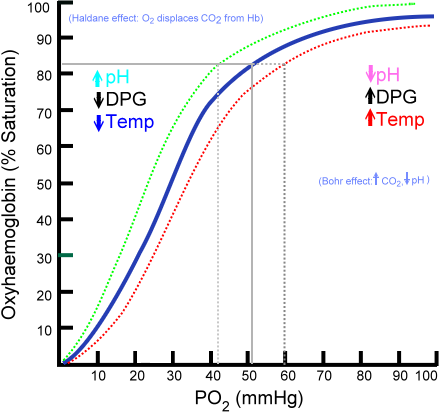
1. Shows the percent O2 saturation (SaO2) of haemoglobin for a certain PaO2.
2. Oxygen saturation of Hb depends on: temperature, pH, 2,3-DPG (based on phosphorus).
3. When the curve is shifted to the right, it reflects a decrease in Hgb affinity for O2 (i.e. higher PaO2 required to maintain the same SaO2). Left: increased Hgb affinity for O2 (i.e. lower PaO2 required to maintain the same SaO2).
4. Mnemonic: Temperature, Acidosis, Phosphorus (TAP) shifts the graph to the right.
5. CO poisoning & methemoglobinemia (Fe in the Hgb molecule is oxidized from the ferrous [Fe2+] to the ferric [Fe3+] form resulting in the inability to hold onto O2 or CO2) shifts the curve to the left.

Image: Ratznium at English WikipediaLater versions were uploaded by Aaronsharpe at en.wikipedia., [Public domain], via Wikimedia Commons [Accessed 14 Aug. 2022].
Reference(s)
Wilkinson, I., Furmedge, D. and Sinharay, R. (2017). Oxford handbook of clinical medicine. Oxford: Oxford University Press. Get it on Amazon.
Feather, A., Randall, D. and Waterhouse, M. (2020). Kumar And Clark’s Clinical Medicine. 10th ed. S.L.: Elsevier Health Sciences. Get it on Amazon.
Hannaman, R. A., Bullock, L., Hatchell, C. A., & Yoffe, M. (2016). Internal medicine review core curriculum, 2017-2018. CO Springs, CO: MedStudy.
Therapeutic Guidelines. Melbourne: Therapeutic Guidelines Limited. https://www.tg.org.au [Accessed 2021].