MRI-DIFFUSION WEIGHTED SEQUENCES (DWI), BRAIN
SUMMARY
1. When we say "DWI" we usually are referring to what is in better terms an isotropic T2 weighted map as it represents the combination of actual diffusion values and T2 signal.
2. It is a relatively low resolution image with the following appearance:
- Grey matter: intermediate signal intensity (grey)
- White matter: slightly hypointense compared to grey matter
- CSF: low signal (black)
- Fat: little signal due to paucity of water
- Other soft tissues: intermediate signal intensity (grey)
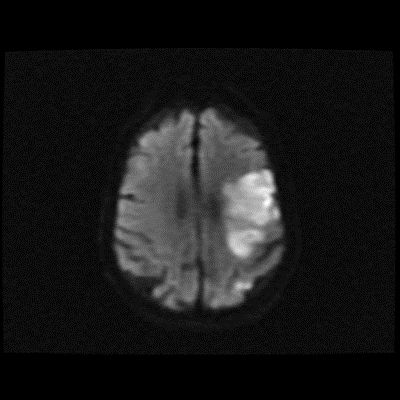
3. Acute pathology (ischaemic stroke, cellular tumour, pus) usually appears as increased signal denoting restricted diffusion.
4. However (and importantly), because there is a component of the image derived from T2 signal, some tissues that are bright on T2 will appear bright on DWI images without there being an abnormal restricted diffusion. This phenomenon is known as T2 shine through.

Image: The above is a DWI axial sequence through the brain demonstrating a (possible) ischemic infarct.
Reference(s)
Furman, Michael B., and Leland Berkwits. Atlas of Image-Guided Spinal Procedures. Elsevier, Inc, 2017.
Horowitz AL. MRI Physics for Physicians. Springer Science & Business Media. (1989) ISBN:1468403338.
Mangrum W, Christianson K, Duncan S et-al. Duke Review of MRI Principles. Mosby. (2012) ISBN:1455700843.