Difference between revisions of "MRI-T2 FAT SUPPRESSED (FATSAT)"
| Line 7: | Line 7: | ||
<br/> | <br/> | ||
<br/>[[Image:paste-00c3494cb8a97d678ed586a92650cc399db8b571.jpg]] | <br/>[[Image:paste-00c3494cb8a97d678ed586a92650cc399db8b571.jpg]] | ||
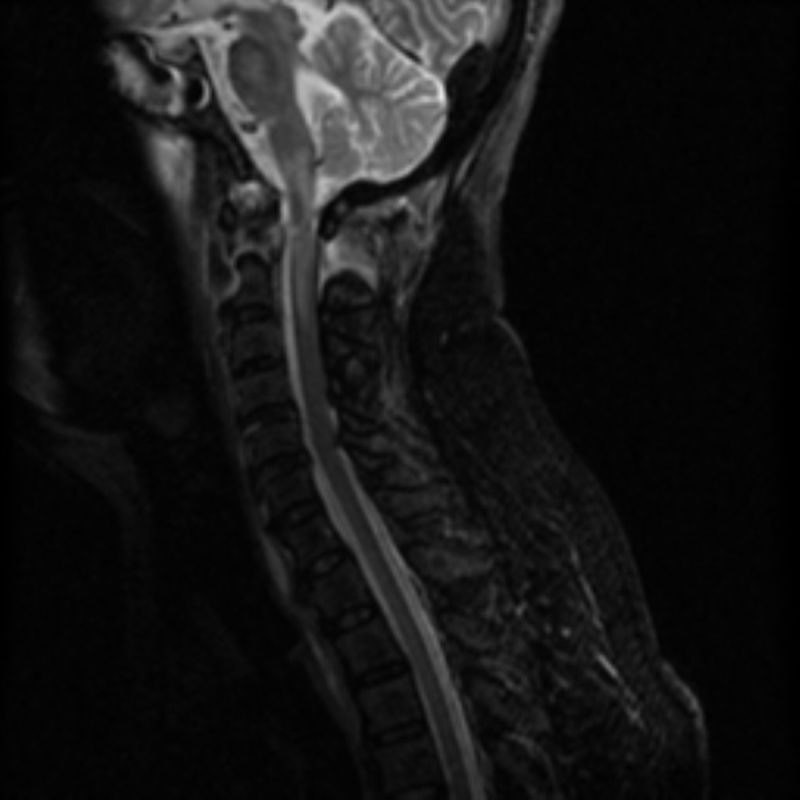
<br/><i>Image: The above is a T2w FATSAT, saggital sequence through the cervical spine demonstrating ligamentous injury at the craniocervical junction. </i> | <br/><i>Image: The above is a T2w FATSAT, saggital sequence through the cervical spine demonstrating ligamentous injury at the craniocervical junction. </i> | ||
Revision as of 10:43, 24 July 2023
SUMMARY
1. In many instances one wants to detect oedema in soft tissues which often have significant components of fat.
2. As such suppressing the signal from fat allows fluid, which is of high signal, to stand out.
3. This can be achieved in a number of ways (e.g. chemical fat saturation or STIR) but the end result is the same.

Image: The above is a T2w FATSAT, saggital sequence through the cervical spine demonstrating ligamentous injury at the craniocervical junction.
Reference(s)
Furman, Michael B., and Leland Berkwits. Atlas of Image-Guided Spinal Procedures. Elsevier, Inc, 2017.
Horowitz AL. MRI Physics for Physicians. Springer Science & Business Media. (1989) ISBN:1468403338.
Mangrum W, Christianson K, Duncan S et-al. Duke Review of MRI Principles. Mosby. (2012) ISBN:1455700843.